Reports
Your clinic in figures: revenue, expenses and net profit, patients, appointments, treatments and outstanding balances, for any period and any doctor, ready to print or export to Excel.
Watch this topic on videoOn this page
The Reports page
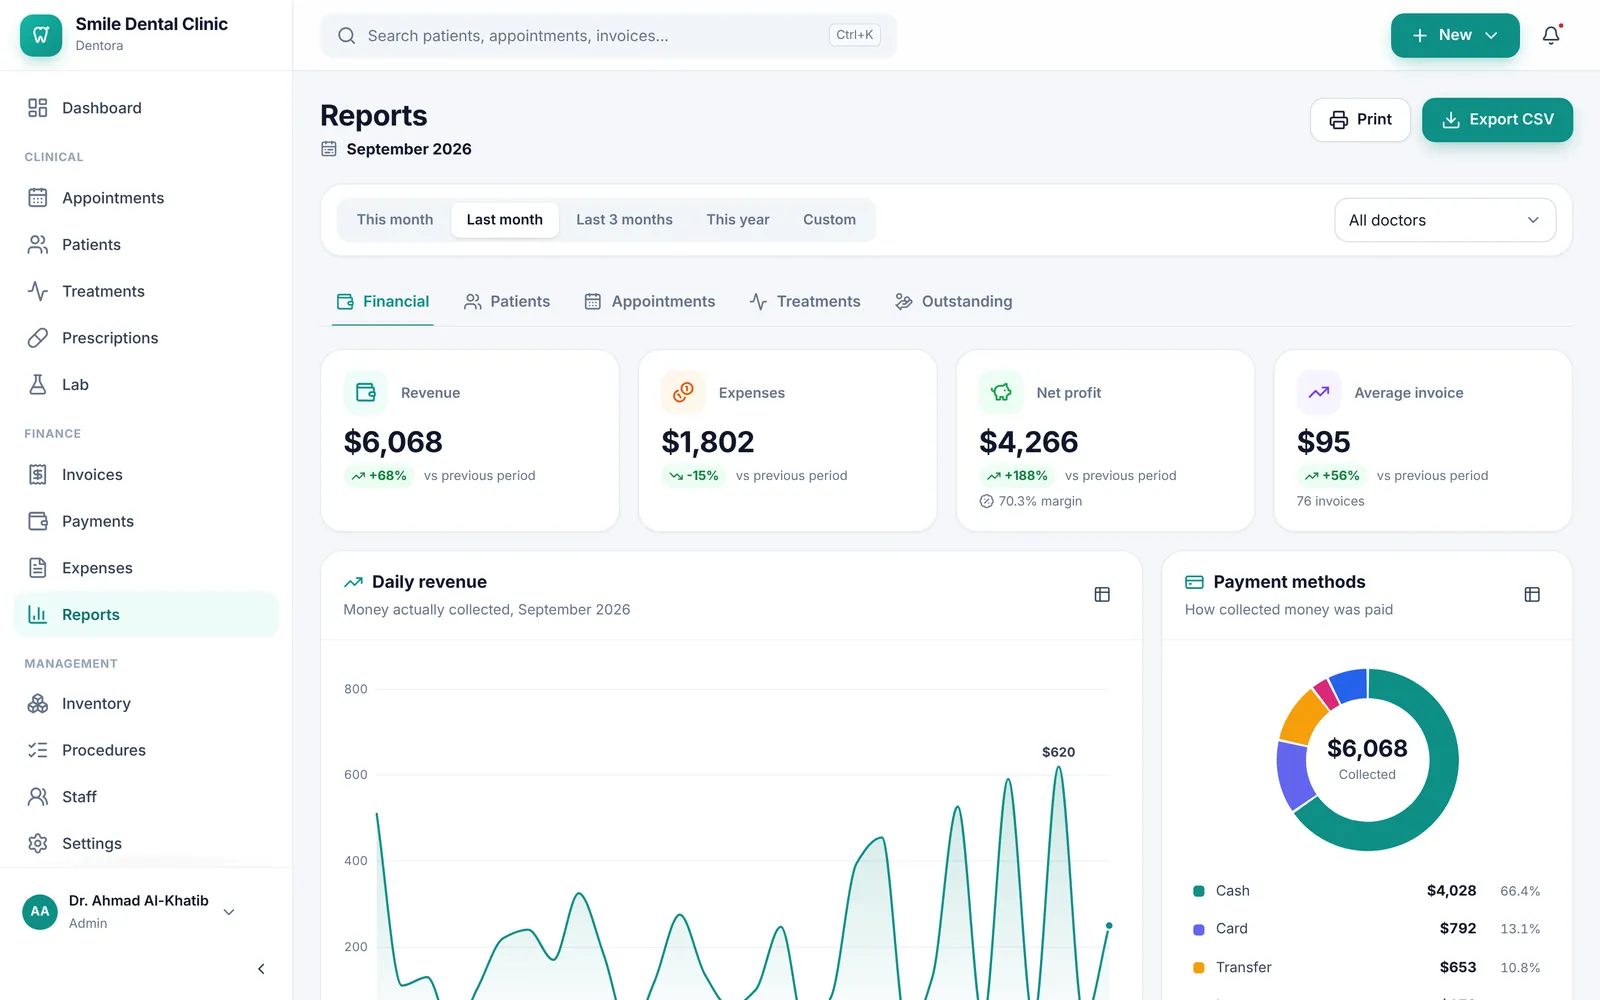
Open Reports from the sidebar, in the Finance section. The page has five tabs: Financial, Patients, Appointments, Treatments and Outstanding.
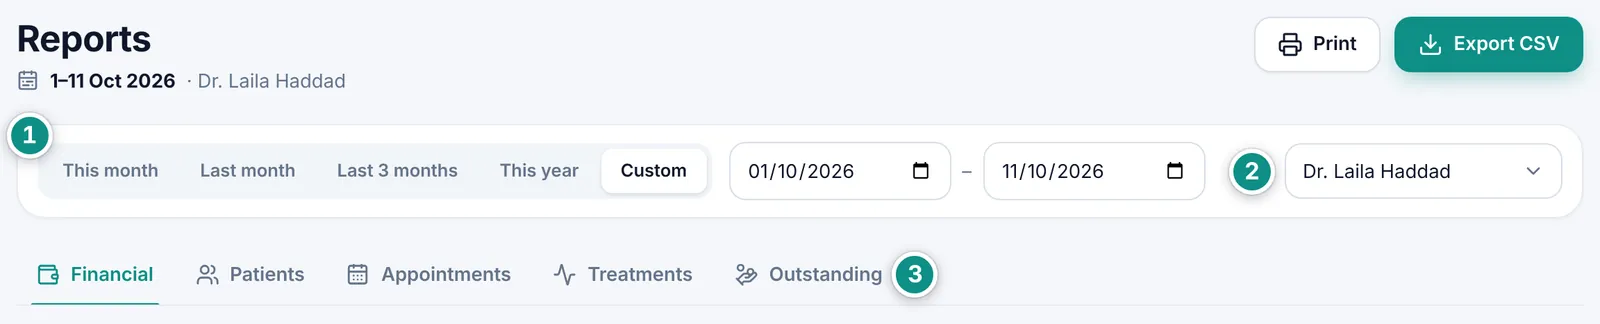
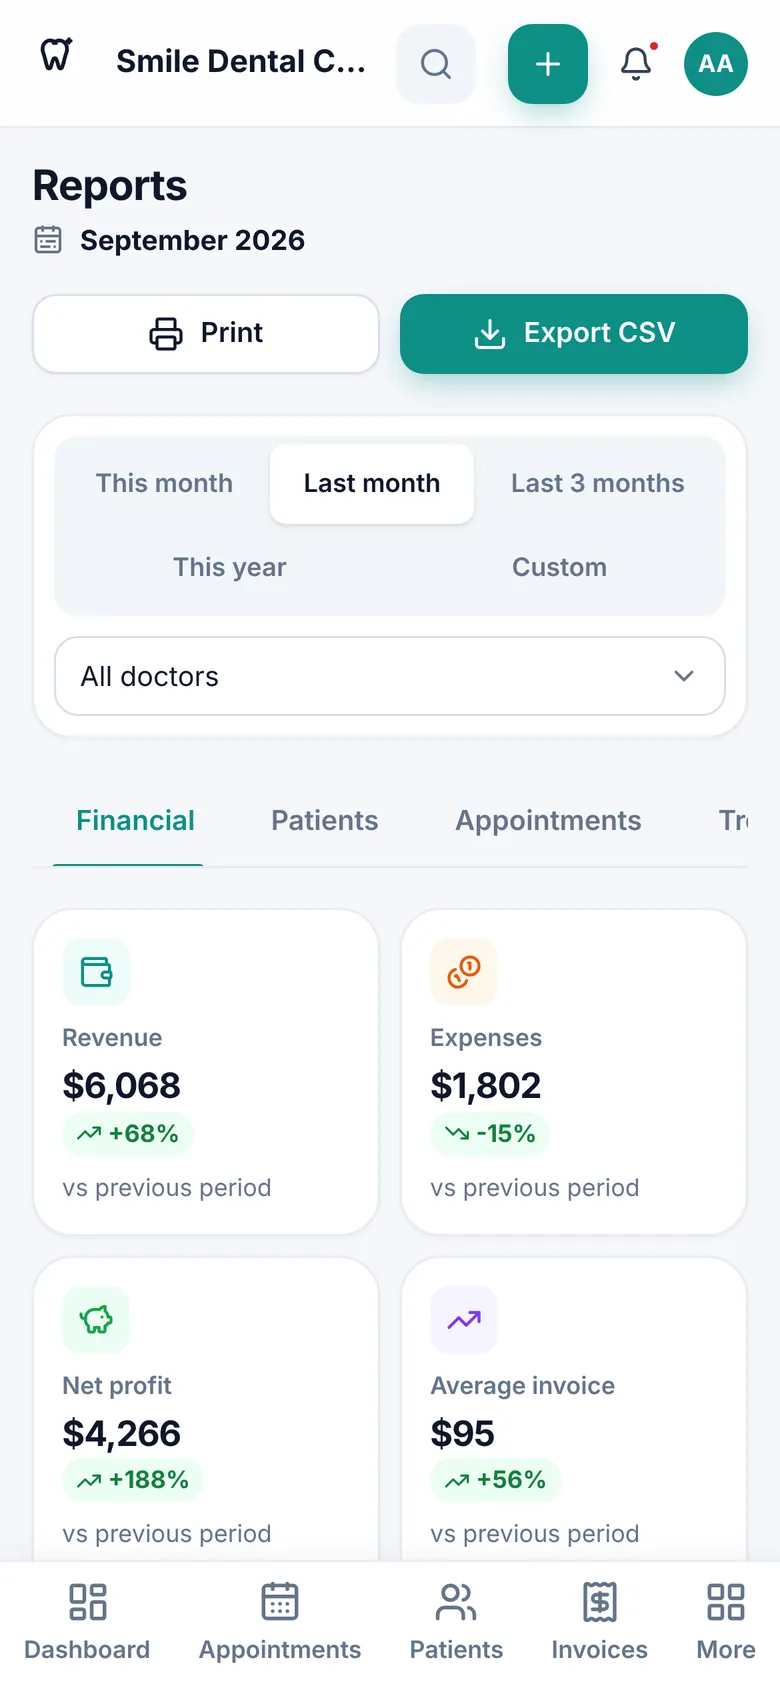
Above the tabs are the period bar and the All doctors list (hidden on Outstanding), and at the top of the page the Print and Export CSV buttons. The chosen period always shows under the title, with the doctor’s name when you pick one; on Outstanding it says which day the balances are for.
Under most figures on the cards is their change vs previous period. While the period is still running, such as This month, Dentora compares the days gone so far with the same days of the period before and says vs same days last period, so the current month never looks weaker than it is.
Choosing the period and the doctor
- Choose the period: This month, Last month, Last 3 months or This year. Or click Custom and choose the start and end dates.
- To see one doctor’s work, pick the doctor from the All doctors list.
- Move between tabs as you like: the period and the doctor stay as you chose them.
Financial: revenue, expenses and profit
Four cards: Revenue, Expenses, Net profit with its margin, and Average invoice with the number of invoices.
Then the charts: Daily revenue (or Monthly revenue for periods longer than two months), Payment methods as a ring splitting the money collected between cash, card, transfer and the rest, Revenue by doctor, which credits each payment to its invoice’s doctor, and Revenue by treatment category, from invoice values after discounts.
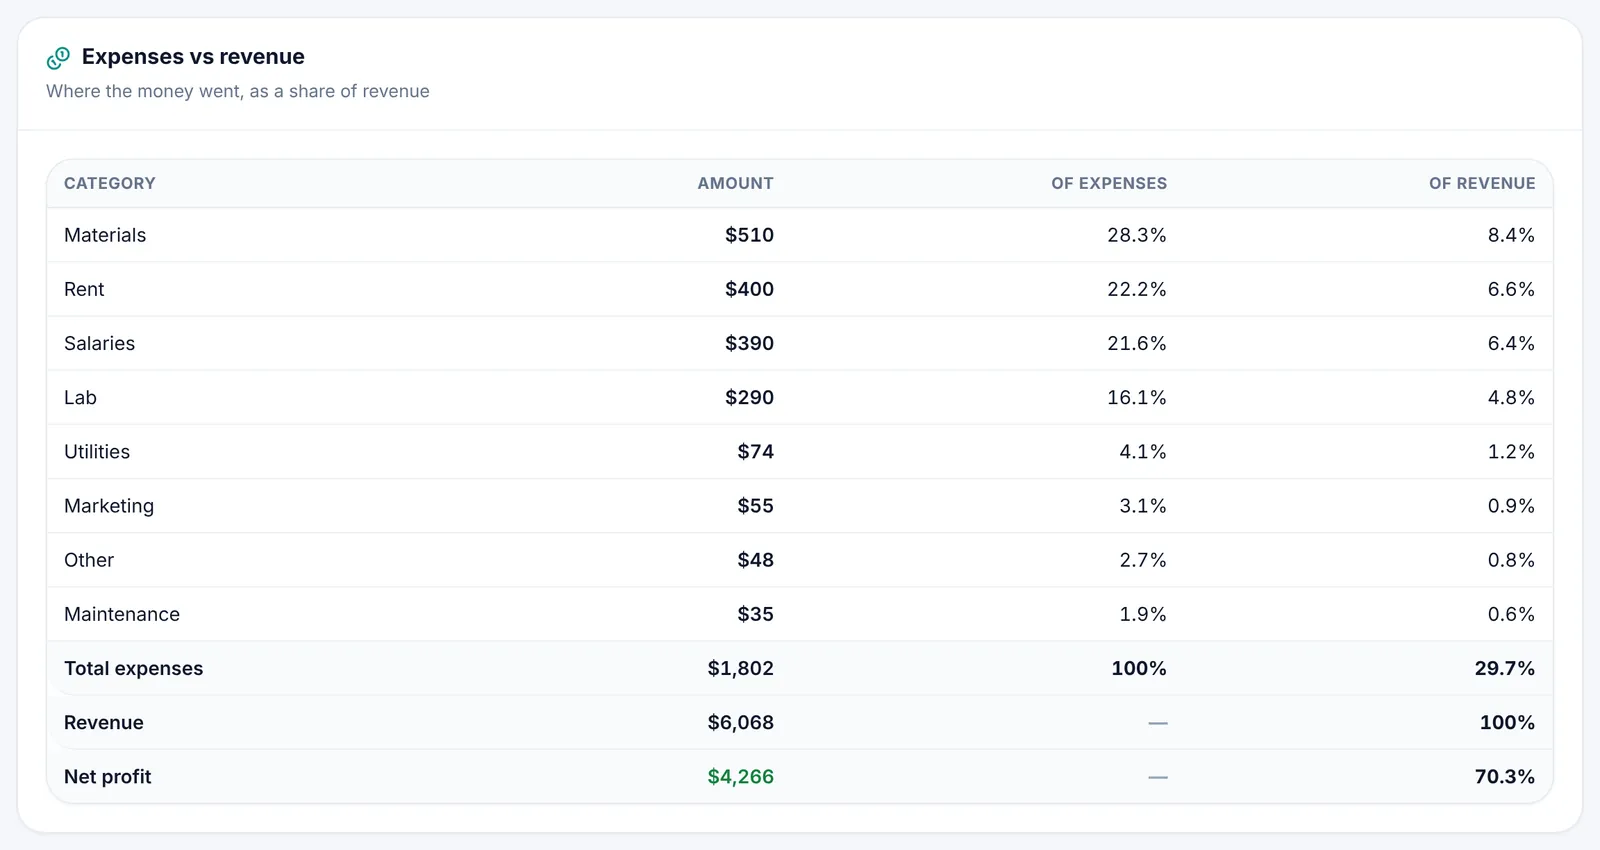
At the bottom, the Expenses vs revenue table lists every expense category with its amount and its share of expenses and of revenue, then Total expenses, Revenue and Net profit.
Patients, appointments and treatments
- Patients: New patients, Patients seen, Active patient files and Average age, then new patients over the period, Gender, Age groups, Top referral sources (how new patients heard of the clinic, from the referral field in their file) and Highest-spending patients.
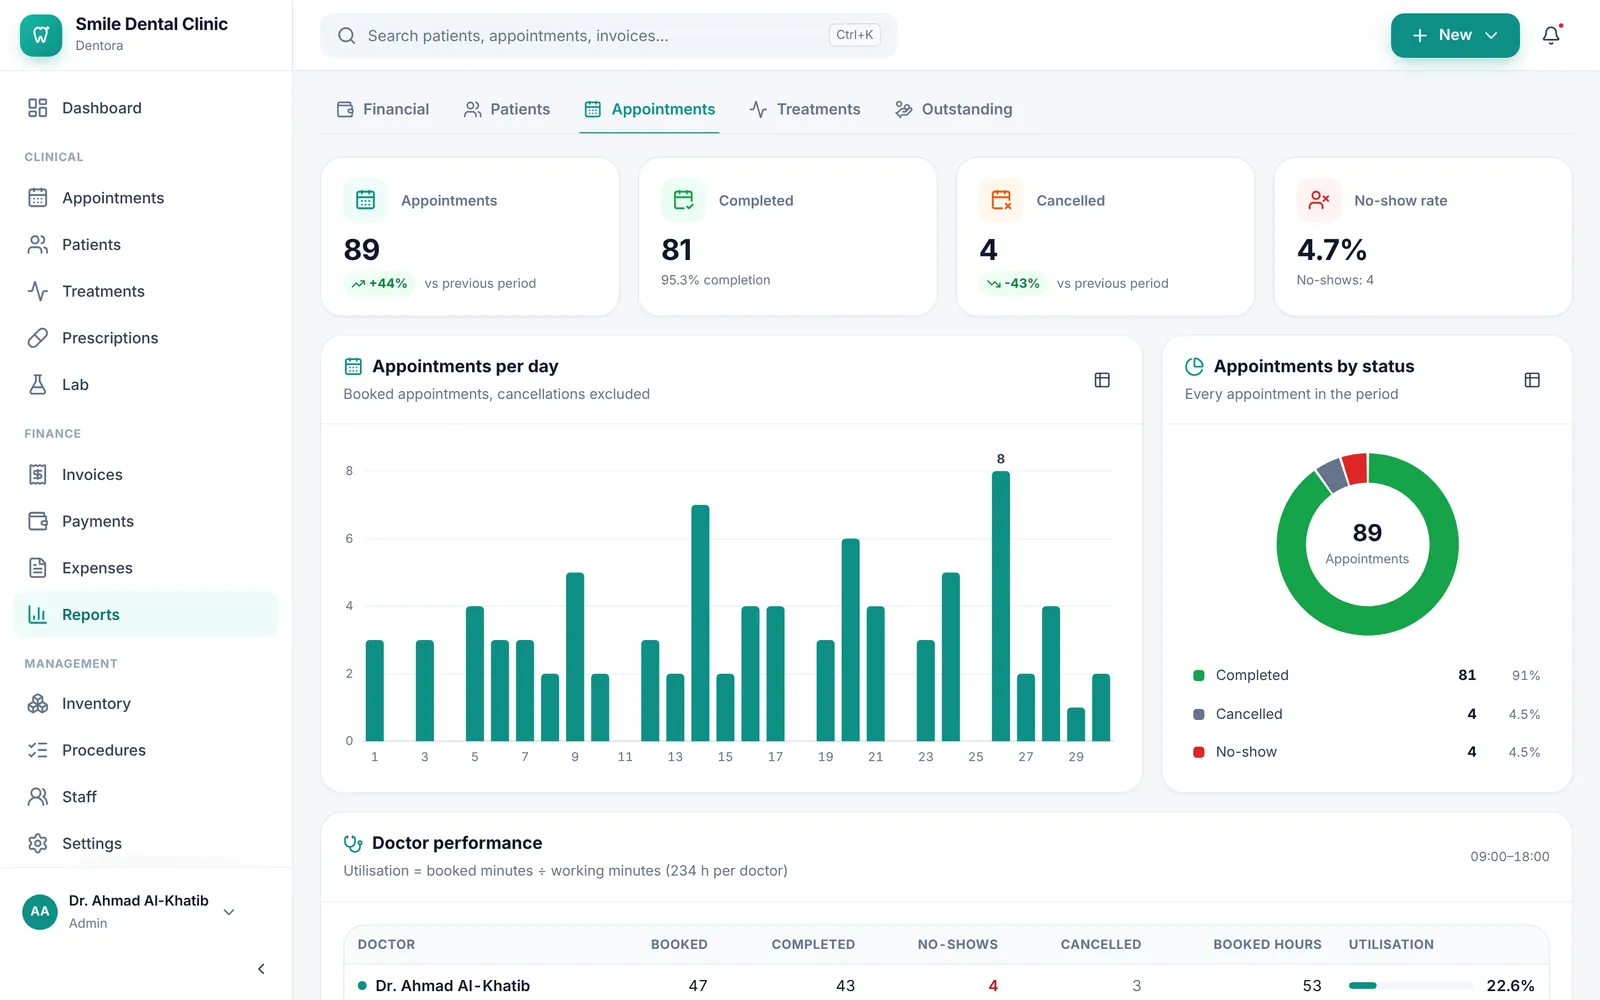
- Appointments: Appointments, Completed with the completion rate, Cancelled and the No-show rate, then booked appointments day by day, week by week or month by month (depending on the length of the period), Appointments by status and the Doctor performance table: booked, completed, no-shows, cancelled, booked hours and Utilisation.
- Treatments: Procedures completed, Value of completed work, Added to plans and Pending work value (planned or in progress), then Most performed procedures, Top procedures by value and Planned vs completed.
Outstanding balances and reminders
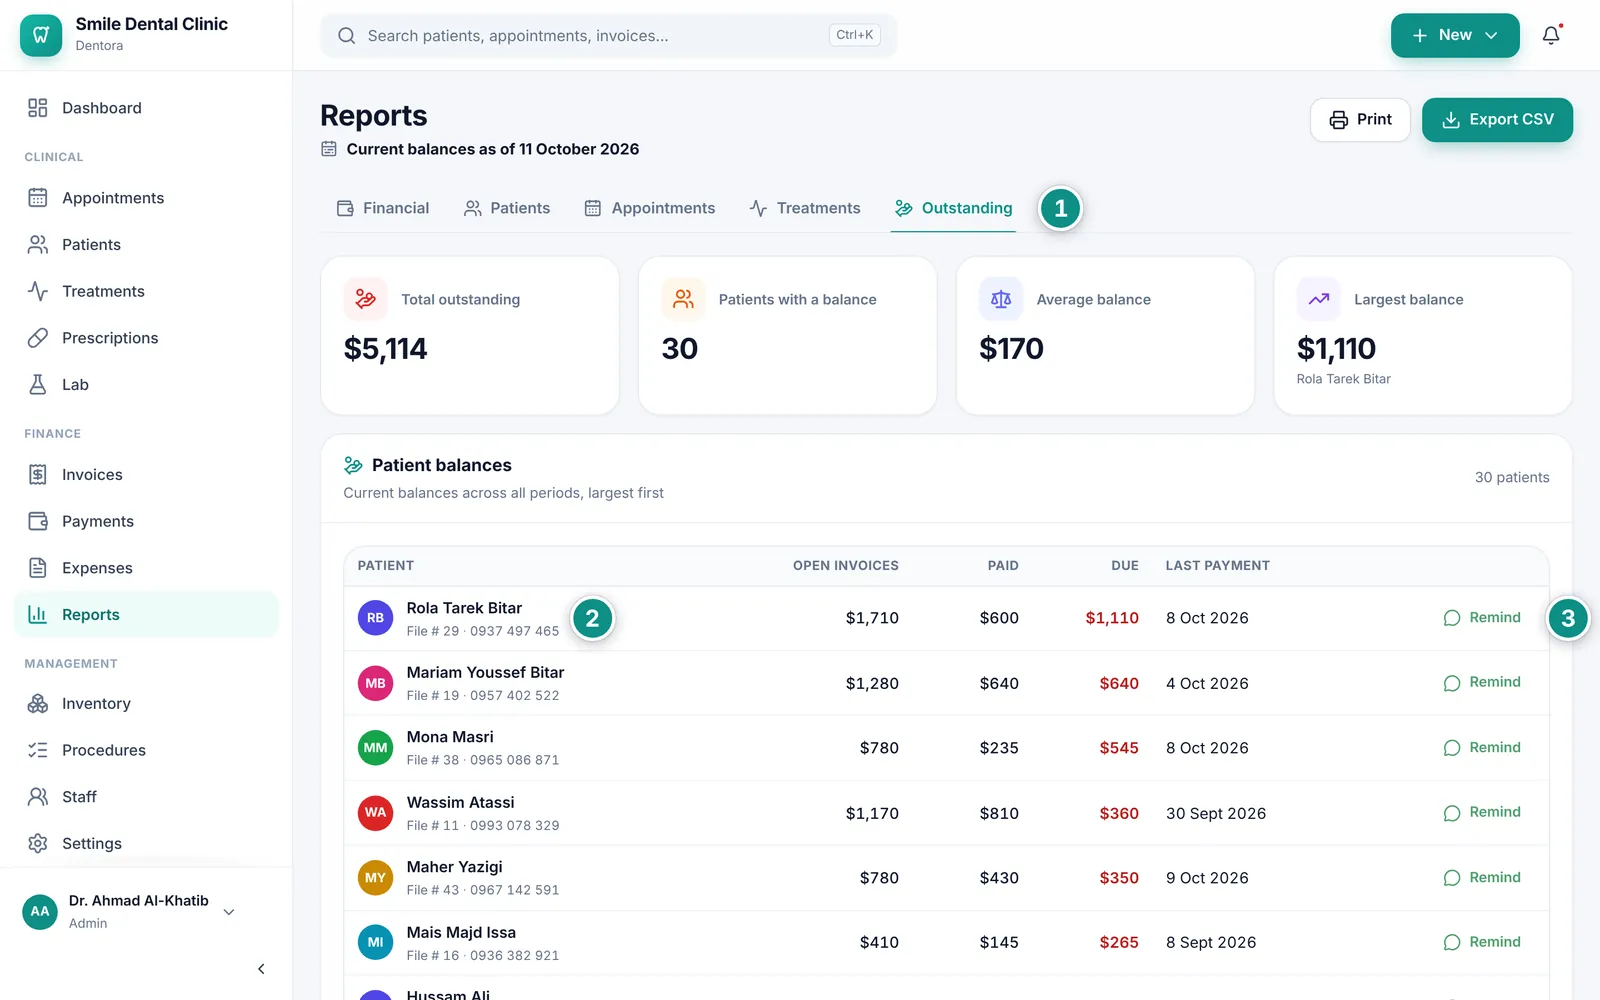
The Outstanding tab shows what patients owe today, across all periods: Total outstanding, Patients with a balance, Average balance and Largest balance with the patient’s name.
Under them the Patient balances table runs from the largest down: Open invoices, Paid, Due and Last payment.
- Open the Outstanding tab.
- Click a patient’s name to open their file; its balance card takes you to their account.
- Click Remind on their row to send them a ready WhatsApp message with the clinic’s name and the amount due.
Figures as a table, printing and export
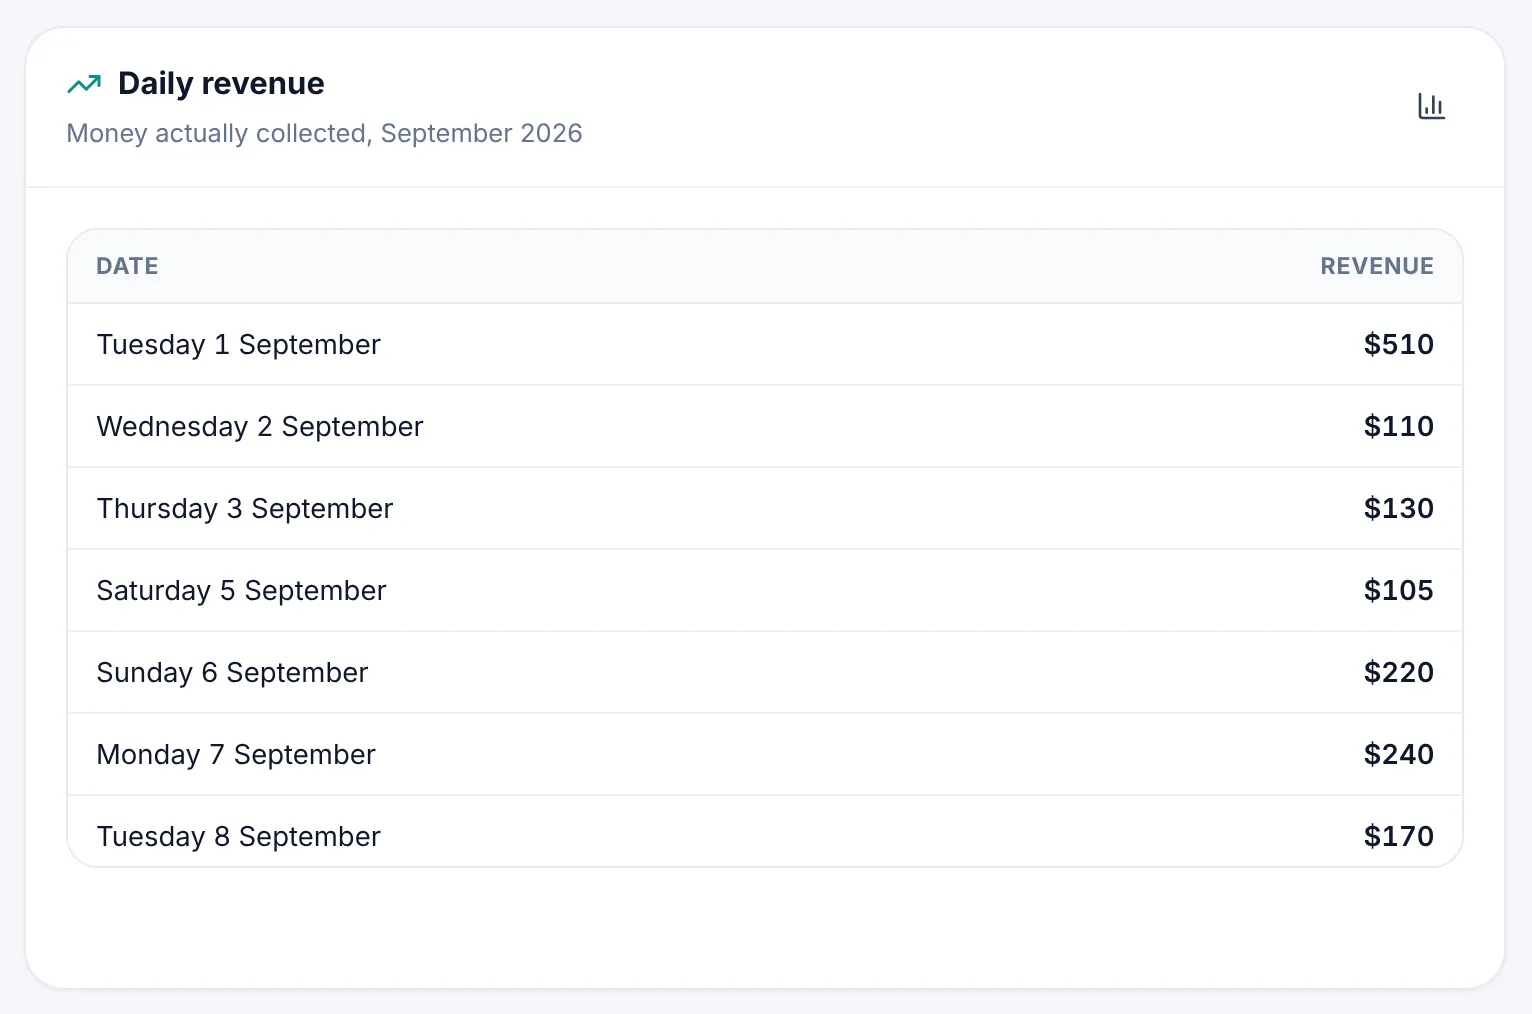
Each chart has a small Show as table button in its corner that shows the exact figures behind the chart. Click it again (Show as chart) to go back to the chart.
- Open the tab you want and choose the period and doctor.
- Click Print to print the open tab, headed with the clinic’s name, the period, the doctor and the print date.
- Or click Export CSV to save the tab’s main table as a file Excel opens.